Implementing Multi Level Security in Windows 7 with VirtualBox and VMLite

I’ve been experimenting with a Multi Level Security implementation in Windows 7 using VirtualBox and VMLite to run Chrome and other browsers inside a virtual machine (guest system) and to use this browser as the default browser for the entire computer (host system) for additional security. This setup allows to click any HTTP link inside pretty much any running program and make that url to load itself into a browser running inside the virtual machine.

This gives us an extra layer of security besides the normal Chrome sandboxing. Also all other usual VM features like snapshotting, reverting to a snapshot, clipboard between host and guest operation system, seamless mode, networking etc are all available. In practice the software running inside VM can’t be easily tell apart from non virtualized programs.

VMLite Workstation is a software built upon VirtualBox which allows to run a Windows XP instance in Seamless mode over a host operating system (Windows 7 in this case). You need a Windows XP license which is available at least with Windows 7 Professional version. This guide shows how to install Windows XP Mode which comes with Windows 7 Professional into a virtual machine and to configure a Chrome browser inside the VM to act as the default browser for the host operating system.

Installation Instructions for VMLites and the Windows XP virtual image:

  1. Download Virtual XP Mode from http://www.microsoft.com/windows/virtual-pc/download.aspx and install it with the default settings.
  2. Download VMLite Workstation from http://www.vmlite.com/index.php/products/vmlite-workstation
  3. Create new Virtual Image inside the VMLite workstation and give it  the installation location of the Virtual XP Mode.
  4. Now you should be able to boot the Virtual XP Mode within VMLite and install Chrome and other softwares which you feel you might need. Here’s a list for ideas which you should do:
    • Change Chrome theme to something else so you can tell apart the Chrome which runs inside the guest vm and the Chrome which runs in your host system.
    • Edit the VM settings to disable full read/write access to the shared folders and drivers and instead just give one predefined directory which you use to transfer files between the guest and the host operating systems.
  5. Remember to take a snapshot from the VM after you have setup your environment. This acts as a restore point in time so you can always reset your VM into this state if you do something stupid or think that the VM is compromised.

Making the Chrome inside VM to be the default browser for everything.

VMLite comes with a “Internet Explorer (secure)” shortcut with green borders which is installed onto your desktop. This shortcut starts Internet Explorer inside the VM. We’ll use this trick to pass Chrome.exe calls from the host system into the guest (VM) system with a .bat file and then making this .bat file the default browser program for the host system.

  1. First create a multilevel-security-browser.bat file by modifying these sources into some good location (I’ve placed it into F:\Users\Garo\VMLites\multilevel-security-browser.bat)
    @echo off
    pushd "C:\Program Files\VMLite\VMLite Workstation\"
    set path="C:\Program Files\VMLite\VMLite Workstation\";%path%
    vmlitectl run "VMLite XP Mode" "C:\Documents and Settings\Administrator\Local Settings\Application Data\Google\Chrome\Application\chrome.exe" "%*"
    popd

    Notice few things: The path line should have the VMLite installation directory inside the host system, the “VMLite XP Mode” should be the name of your VM and the chrome.exe path is the browser path inside the guest vm.

  2. Then create a multilevel-security-browser.reg file based on these sources:
    Windows Registry Editor Version 5.00
    
    [HKEY_CLASSES_ROOT\MultilevelSecurityBrowser]
    @="MultilevelSecurityBrowser"
    "URL Protocol"=""
    
    [HKEY_CLASSES_ROOT\MultilevelSecurityBrowser\DefaultIcon]
    @="C:\\Users\\garo\\AppData\\Local\\Google\\Chrome\\Application\\chrome.exe,0"
    
    [HKEY_CLASSES_ROOT\MultilevelSecurityBrowser\shell]
    
    [HKEY_CLASSES_ROOT\MultilevelSecurityBrowser\shell\open]
    
    [HKEY_CLASSES_ROOT\MultilevelSecurityBrowser\shell\open\command]
    @="\"f:\\Users\\garo\\VMLites\\multilevel-security-browser.bat\" -- \"%1\""
    
    [HKEY_CURRENT_USER\Software\Microsoft\Windows\Shell\Associations\UrlAssociations\http\UserChoice]
    "Progid"="MultilevelSecurityBrowser"

    and set the path for chrome.bat to the path where you created your multilevel-security-browser.bat. Notice that we use the chrome.exe as the source of our DefaultIcon which assumes that you have Chrome also installed into your host operating system.

  3. Save the multilevel-security-browser.reg file and click to Merge its contents with the Windows 7 registry. UAC will ask for a confirmation which you need to allow.
  4. We’re pretty much done here. You can now try to click some http url and if everything went correctly a black shell window will appear for a moment and the VM is started (if it isn’t already running) and the url should be opened inside Chrome in the guest vm.

I’ve used this setup only for a day now and so far it has worked nicely. the VMLite can be turned into Seamless mode and the Windows XP taskbar can be moved on the top of the screen and set it to Auto-Hide the taskbar.

Saunalahden mokkulan asennus OS X:ään, error 5370

Törmäsin asennusongelmiin Saunalahden mobiilitikun ohjelmiston kanssa yrittäiessäni asentaa sitä OS X:ään (10.6.5). Asennusohjelma ilmoitti virheen “An internal error has occured during configuration (5370)”.

Ongelma voidaan ratkaista seuraavasti:

  1. Avaa Pääte (Terminal)
  2. Kirjaudu superkäyttäjäksi komennolla sudo ja antamalla oma salasanasi.
  3. Siirry oikeaan hakemistoon komennolla: cd “/Applications/Elisa/Mobiililaajakaista opastettu asennus.app/Contents/MacOS” (huomaa lainausmerkit ja välilyönnit)
  4. Käynnistä asennusohjelma komennolla: ./MobileManager\ Setup\ Assistant

Asennusohjelman pitäisi tämän jälkeen suoriutua tehtävästään ongelmitta.

Crash course to Java JVM memory issues to sysadmins

Are you a sysadmin who is new to Java? Then you might find this post to be helpful.

Java has its own memory management system with garbage collection which is most of the time really nice, but you need to know some details how it works so you can administrate your JVM instances effectively.

How Java manages memory?

At the beginning Java JVM will allocate a block of memory from the OS to its heap which it will distribute to the program running inside the JVM. The amount is controlled with two command line arguments: -Xms tells how much memory JVM will allocate at the start and -Xmx what’s the maximum amount of memory which JVM can allocate from the OS. For example -Xms512m -Xmx1G will tell java to start with half gigabyte at the beginning and allow it to grow to one gigabyte.

As the Java program runs it allocates memory for the objects from the JVM heap. This will result the heap to grow until a GC (garbage collection) threshold is  reached. This will trigger the JVM to see which objects are no longer used (objects which are not referenced by any working object) and it will free this memory back to the heap. There are numerous ways how this can work in different GC implementations (Java has many of them) and they’re out of the scope of this article. The main point is that the Java heap usage will grow until about 80% usage when the GC occurs and then drop back to much lower level. If you use jconsole to watch the free memory you will see something like this:
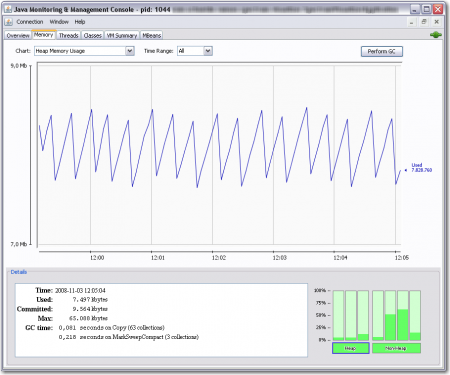
The saw tooth like pattern is just normal life Java garbage collection and nothing to worry about. This however will make it difficult to know how much memory the program actually uses needs.

What happens when Java runs out of memory?

If JVM can’t free enough memory with a simple GC it will run a Full GC which will be a stop-the-world collection. This suspends the JVM execution until the collection is done.  A Full GC can be seen as a sudden drop on the amount of used memory, for example as seen in this image. The Full GC in this case took 0.8 seconds. It’s not much, but it did suspend the program execution for that time, so keep that in mind when designing your Java software and its real time requirements.
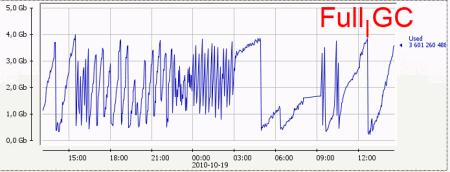
The Full GC will be able to free enough memory so that the program will continue, but if the JVM simply has not enough memory it will need to trigger another Full GC shortly. This can result in a GC storm where the program spends even more time doing even longer Full GC’s and finally running out of memory.  It’s not uncommon to see Full GC taking over two minutes in these situations and remember, the program is suspended during a Full GC! No need to say that this is bad, right?

However giving JVM too much memory is also bad. This will make the JVM happy as it doesn’t need to do Full GCs, but then the small GCs can take longer and if you eventually run into a Full GC situation it will take long. Very long. Thus you need to think how much memory your program will need and setup the JVM -Xms and -Xmx so that it has enough plus additional “gc breathing room” on top of that.

How the OS sees all this?

When the JVM starts and allocates the amount of memory specified in -Xms the OS will not immediately allocate all this memory but thanks to the modern virtual memory management the OS reserves this to be used later. You can see this in the VIRT column in top. Once the Java program starts to actually use this memory the OS will need to provide the memory and thus you can see the program RES column value to grow. VIRT means how much virtual memory has been allocated and mapped to the process (this includes the JVM heap memory plus JVM code and other libraries) and RES means how much memory from all VIRT memory is actually in the ram.

The Java in the image above has too big amount of memory. The program was started with 384MB heap (-Xms384m) but it was allowed to grow up to one gigabyte (-Xmx1G), but the program is actually using just 161 megabytes out of it.

However when the JVM GC runs and frees the memory back to the application, the memory is not given back to the OS. Thus you will see the RES value to grow up to VIRT, but never to actually decrease unless the OS chooses to swap some of the JVM memory out to disk. This can happen easily if you specify too big heap to the JVM which doesn’t get used and you should try to avoid this.

Top Tip for Top: You can press f to add and hide columns like SWAP. Notice that SWAP isn’t actually the amount of memory which has been swapped to disk. According to top manual: VIRT = SWAP + RES. Swap contains both the pages which has been swapped to disk and pages which hasn’t yet been actually used. See for more very usefull top commands by pressing ?.

How can I monitor all this?

The best way is to use JMX with some handy tool like jconsole. JConsole is a GUI utility which comes with all JDK distributions and can be found under the bin/ directory (jconsole.exe in windows). You can use the jconsole to connect into a running JVM and extract a lot of different metrics out of it and even tweak some settings on the fly.

JMX needs to be enabled, which can be done by adding these arguments to the JVM command line:

-Dcom.sun.management.jmxremote=true -Dcom.sun.management.jmxremote.port=8892 -Dcom.sun.management.jmxremote.ssl=false -Dcom.sun.management.jmxremote.authenticate=false -Dcom.sun.management.jmxremote=true

Notice that these settings disable authentication and ssl, so you should not do this unless your network is secured from the outside. You can also feed this data into monitor systems like Zabbix (my favourite), Cacti or Nagios, which I have found very helpful when debugging JVM performance.

Other way is to enable GC logging which can be done in Sun JVM with these command line parameters (these are reported to be working also with OpenJDK but I haven’t tested)

-XX:+PrintGCTimeStamps -XX:+PrintGC -Xloggc:/some/dir/cassandra.gc.log

These will print GC statistics to the log file, here’s an actual example:

17500.125: [GC 876226K->710063K(4193024K), 0.0195470 secs]
17569.086: [GC 877871K->711547K(4193024K), 0.0200440 secs]
17641.289: [GC 879355K->713210K(4193024K), 0.0201440 secs]
17712.079: [GC 881018K->714931K(4193024K), 0.0212350 secs]
17736.576: [GC 881557K->882170K(4193024K), 0.0419590 secs]
17736.620: [Full GC 882170K->231044K(4193024K), 0.8055450 secs]
17786.560: [GC 398852K->287047K(4193024K), 0.0244280 secs]

The first number is seconds since JVM startup, the second tells the GC type (normal vs. Full GC) and how much memory was freed.

Conclusion

  • Java JVM will eat all the memory which you give to it (this is normal)
  • You need to tune the JVM -Xms and -Xmx parameters to give it enough but not too much memory so your application works.
  • The memory wont be released back to the OS until JVM exists, but the OS can swap the JVM memory out. Usually this is bad and you need to decrease the memory you give to the JVM.
  • Use JMX to monitor the JVM memory usage to find suitable values.

Script and template to export data from haproxy to zabbix

I’ve just created a zabbix template with a script which can be used to feed performance data from haproxy to zabbix. The script firsts uses HTTP to get the /haproxy?stats;csv page, parses the CSV and uses zabbix_sender command line tool to send each attribute to the zabbix server. The script can be executed on any machine which can access both zabbix server and the haproxy stats page (I use the machine which runs the zabbix_server). The script and template works on both zabbix 1.6.x and 1.8.x.

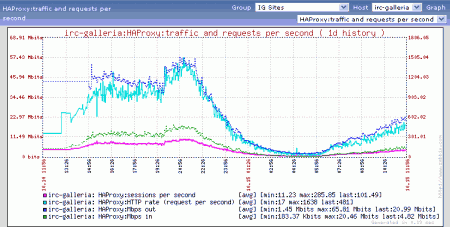
As the haproxy server names might differ from zabbix server names, the script uses annotations inside the haproxy.cfg hidden in comments. The annotations tell the script which frontend and server node statistics should be sent to the zabbix server. This allows you to keep the configuration in a central place which helps keeping the haproxy and zabbix configurations in sync. The template includes two graphs, example below:

I’ve chosen to export following attributes from haproxy, but more could be easily added (I accept patches via github.com):

  • Current session count
  • Maximum session count
  • Sessions per second
  • HTTP responses per minute, grouped by 1xx, 2xx, 3xx, 4xx and 5xx.
  • Mbps in (network traffic)
  • Mbps out (network traffic)
  • Request errors per minute
  • Connection errors per minute
  • Response errors per minute
  • Retries (warning) per minute
  • Rate (sessions per second)
  • HTTP Rate (requests per second)
  • Proxy name in haproxy config
  • Server name in haproxy config

The code is available at github: https://github.com/garo/zabbix_haproxy The script supports HTTP Basic Authentication and masking the HTTP Host-header.

Usage:

  1. Import the template_haproxyitems.xml into Zabbix.
  2. Add all your webservers to zabbix as hosts and link them with the Template_HAProxyItem
  3. Add all your frontends to zabbix as hosts and link them with the Template_HAProxyItem. The frontend hosts don’t need to be mapped to any actual ip nor server, I use the zabbix_server ip as the host ip for these.
  4. Edit your haproxy.cfg file and add annotations for the zabbix_haproxy script. These annotations mark which frontends and which servers you map into zabbix hosts. Notice that the annotations are just comments after #, so haproxy ignores them.
    frontend irc-galleria # @zabbix_frontend(irc-galleria)
            bind            212.226.93.89:80
            default_backend lighttpd
    
    backend lighttpd
            mode            http
            server  samba           10.0.0.1:80    check weight 16 maxconn 200   # @zabbix_server(samba.web.pri)
            server  bossanova       10.0.0.2:80    check weight 16 maxconn 200   # @zabbix_server(bossanova.web.pri)
            server  fuusio          10.0.0.3:80     check weight 4 maxconn 200   # @zabbix_server(fuusio.web.pri)
  5. Setup a crontab entry to execute the zabbix_haproxy script every minute.  I use the following entry in /etc/crontab:
    */1 * * * * nobody zabbix_haproxy -c /etc/haproxy.cfg -u "http://irc-galleria.net/haproxy?stats;csv" -C foo:bar -s [ip of my zabbix server]
  6. All set! Go and check the latests data in zabbix to see if you got the values. If you have problems you can use -v and -d command line arguments to print debugging information.

Oneliner: erase incorrect memcached keys on demand

We had a situation where our image thumbnail memcached cluster somehow got empty thumbnails. The thumbnails are generated on the fly by image proxy servers and the thumbnail is stored into memcached. For some reason some of the thumbnails were truncated.

As I didn’t have time to start debugging the real issue, I quickly wrote this oneliner which detects corrupted thumbnails when the thumbnail is fetched from the memcached and issues a delete operation to it. This will keep the situation under control until I can start the actual debugging. We could also have restarted the entire memcached cluster, but it would result in big preformance penalty for several hours. Fortunately all corrupted thumbnails are just one byte long, so detecting them was simple enough to do with an oneliner:

tcpdump -i lo -A -v -s 1400 src port  11213 |grep VALUE | perl -ne 'if (/VALUE (cach[^ ]+) [-]?\d+ (.+)/) { if ($2 == 1) { `echo "delete $1 noreply\n" | nc localhost 11213`; print "deleted $1\n"; } }'

Here’s how this works:

  1. tcpdump prints all packets in ascii (-A) which come from port 11213 (src port 11213), our memcached node,  from interface loopback (-i lo)
  2. the grep passes only those lines which contains the response header which has the following form: “VALUE <key> <flags> <length>
  3. for each line (-n) the perl executes the following script (-e ‘<script>’) which first uses regexp to catch the key “(cach[^ ]+)” and then the length.
  4. It then checks if the length is 1 if ($2 == 1) and on success it executes a shell command which sends a “delete <key> noreply” message to the memcached server using netcat (nc). This command will erase the corrupted value from memcached server.
  5. Last it prints a debug message

Open BigPipe javascript implementation

We have released our open BigPipe implementation written for IRC-Galleria which is implemented by loosely following this facebook blog. The sources are located at github: https://github.com/garo/bigpipe and there’s an example demonstrating the library in action at http://www.juhonkoti.net/bigpipe.

BigPipe allows speeding up page rendering times by loading the page in small parts called pagelets. This allows browser to start rendering the page while the php server is still processing to finish the rest. This transforms the traditional page rendering cycle into a streaming pipeline containing the following steps:

  1. Browser requests the page from server
  2. Server quickly renders a page skeleton containing the <head> tags and a body with empty div elements which act as containers to the pagelets. The HTTP connection to the browser stays open as the page is not yet finished.
  3. Browser will start downloading the bigpipe.js file and after that it’ll start rendering the page
  4. The PHP server process is still executing and its building each pagelet at a time. Once a pagelet  has been completed it’s results are sent to the browser inside a <script>BigPipe.onArrive(…)</script> tag.
  5. Browser injects the html code received into the correct place. If the pagelet needs any CSS resources those are also downloaded.
  6. After all pagelets have been received the browser starts to load all external javascript files needed by those pagelets.
  7. After javascripts are downloaded browser executes all inline javascripts.

There’s an usage example in example.php. Take a good look on it. The example uses a lot of whitespace padding to saturate web server and browser caches so that the bigpipe loading effect is clearly visible. Of course these paddings are not required in real usage. There’s still some optimizations to be done and the implementation is way from being perfect, but that hasn’t stopped us from using this in production.

Files included:

  • bigpipe.js Main javascript file
  • h_bigpipe.inc BigPipe class php file
  • h_pagelet.inc Pagelet class php file
  • example.php Example showing how to use bigpipe
  • test.js Support file for example
  • test2.js Support file for example
  • README
  • Browser.php Browser detection library by Chris Schuld (http://chrisschuld.com/)
  • prototype.js Prototypejs.org library
  • prototypepatch.js Patches for prototype

How NoSQL will meet RDBMS in the future

The NoSQL versus RDBMS war started a few years ago and as the new technologies are starting to get more mature it seems that the two different camps will be moving towards each other. Latests example can be found at http://blog.tapoueh.org/blog.dim.html#%20Synchronous%20Replication where the author talks about upcoming postgresql feature where the application developer can choose the service level and consistency of each call to give hint to the database cluster what it should do in case of database node failure.

The exact same technique is widely adopted in Cassandra where each operation has a consistency level attribute where the programmer can decide if he wants full consistency among entire cluster or is it acceptable if the result might not contain the most up to date data in case of node failure (and also gain extra speed for read operations) . This is also called Eventual Consistency.

The CAP theorem says that you can only have two out of three features from a distributed application: Consistency, Availability and Partition Tolerance (hence the acronym CAP). To give example: If you choose Consistency and Availability, your application cannot handle loss of a node from your cluster. If you choose Availability and Partition Tolerance, your application might not get most up-to-date data if some of your nodes are down. The third option is to choose Consistency and Partition Tolerance, but then your entire cluster will be down if you lost just one node.

Traditional relation databases are designed around the ACID principle which loosely maps to Consistency and Partition Tolerance in the CAP theorem. This makes it hard to scale an ACID into multiple hosts, because ACID needs Consistency. Cassandra in other hand can swim around the CAP theorem just fine because it allows the programmer to choose between Availability + Partition Tolerance  and Consistency + Availability.

In the other hand as nosql technology matures they will start to get features from traditional relation databases. Things like sequences, secondary indexes, views and triggers can already be found in some nosql products and many of them can be found from roadmaps. There’s also the ever growing need to mine the datastorage to extract business data out of it. Such features can be seen with Cassandra hadoop integration and MongoDB which has internal map-reduce implementation.

Definition of NoSQL: Scavenging the wreckage of alien civilizations, misunderstanding it, and trying to build new technologies on it.

As long as nosql is used wisely it will grow and get more mature, but using it without good reasons over RDBMS is a very easy way to shoot yourself in your foot. After all, it’s much easier to just get a single powerfull machine like EC2 x-large instance and run PostgreSQL in it, and maybe throw a few asynchronous replica to boost read queries. It will work just fine as long as the master node will keep up and it’ll be easier to program.


Good analysis paper over Stuxnet worm

The W32.Stuxnet worm has raised quite much discussion as its been analysed and technical details about its construction has been revealed. Stuxnet is special because it’s very complex and its targeted to attack very specific set of industrial process computers. These and other worm characteristics hints that the worm was created by a government  sponsored virus laboratory.

Some notable Stuxnet features include:

  • Four zero day exploits to windows operating system.
  • Stolen driver authentication certificates, including two from Realtek
  • Targeted to specific installation – it didn’t infect if it found to be in wrong computer.
  • Very installation specific payload which altered the process of the industrial control operations.

The following quote from [http://langner.com/en/] sums up all this pretty well:

The attack combines an awful lot of skills — just think about the multiple 0day vulnerabilities, the stolen certificates etc. This was assembled by a highly qualified team of experts, involving some with specific control system expertise. This is not some hacker sitting in the basement of his parents house. To me, it seems that the resources needed to stage this attack point to a nation state.

Read the full analysis paper at http://www.eset.com/resources/white-papers/Stuxnet_Under_the_Microscope.pdf

Also read the symantec blog at http://www.symantec.com/connect/blogs/exploring-stuxnet-s-plc-infection-process

Example how to model your data into nosql with cassandra

We have built a facebook style “messenger” into our web site which uses cassandra as storage backend. I’m describing the data schema to server as a simple example how cassandra (and nosql in general) can be used in practice.

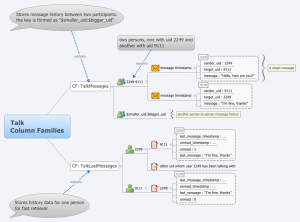
Here’s a diagram on the two column families and what kind of data they contain. Data is modelled into two different column families: TalkMessages and TalkLastMessages. Read more for deeper explanation what the fields are.

TalkMessages contains each message between two participants. The key is a string built from the two users uids “$smaller_uid:$bigger_uid”. Each column inside this CF contains a single message. The column name is the message timestamp in microseconds since epoch stored as LongType. The column value is a JSON encoded string containing following fields: sender_uid, target_uid, msg.

This results in following structure inside the column family.

"2249:9111" => [
  12345678 : { sender_uid : 2249, target_uid : 9111, msg : "Hello, how are you?" },
  12345679 : { sender_uid : 9111, target_uid : 2249, msg : "I'm fine, thanks" }
]

TalkLastMessages is used to quickly fetch users talk partners, the last message which was sent between the peers and other similar data. This allows us to quickly fetch all needed data which is needed to display a “main view” for all online friends with just one query to cassandra. This column family uses the user uid as its key. Each column
represents a talk partner whom the user has been talking to and it uses the talk partner uid as the column name. Column value is a json packed structure which contains following fields:

  • last message timestamp: microseconds since epoch when a message was last sent between these two users.
  • unread timestamp : microseconds since epoch when the first unread message was sent between these two users.
  • unread : counter how many unread messages there are.
  • last message : last message between these two users.

This results in following structure inside the column family for these
two example users: 2249 and 9111.

"2249" => [
  9111 : { last_message_timestamp : 12345679, unread_timestamp : 12345679, unread : 1, last_message: "I'm fine, thanks" }

],
"9111" => [
  2249 : { last_message_timestamp :  12345679, unread_timestamp : 12345679, unread : 0, last_message: "I'm fine, thanks" }
]

Displaying chat (this happends on every page load, needs to be fast)

  1. Fetch all columns from TalkLastMessages for the user

Display messages history between two participants:

  1. Fetch last n columns from TalkMessages for the relevant “$smaller_uid:$bigger_uid” row.

Mark all sent messages from another participant as read (when you read the messages)

  1. Get column $sender_uid from row $reader_uid from TalkLastMessages
  2. Update the JSON payload and insert the column back

Sending message involves the following operations:

  1. Insert new column to TalkMessages
  2. Fetch relevant column from TalkLastMessages from $target_uid row with $sender_uid column
  3. Update the column json payload and insert it back to TalkLastMessages
  4. Fetch relevant column from TalkLastMessages from $sender_uid row with $target_uid column
  5. Update the column json payload and insert it back to TalkLastMessages

There are also other operations and the actual payload is a bit more complex.

I’m happy to answer questions if somebody is interested :)

Cassandra operation success ratio survey results

It’s known that in Cassandra the compaction hurts the node performance so that the node might miss some requests. That’s why it’s important to handle these situations and the client needs to retry the operation into another working host. We have been storing performance data from each cassandra request which we do into our five node cassandra production cluster.

We log the retry count and request type into our data warehouse solution and I’ve now extracted the data from a 10 day period and calculated how many retry requests is needed so that the results can be obtained. The following chart tells how many time an operation had to be retried until it was successfully completed. The percents tells the probability like that “the request will be successful with the
first try in 99.933 % times.”

Total amount of operations: 94 682 251 within 10 days.

Retry times operations percentage from total operations
0 94618468 99.93263 %
1 56688 0.05987 %
2 5018 0.00529 %
3 1359 0.00144 %
4 111 0.00012 %
5 25 0.00003 %

There were also few operations which needed more than five retries, so preparing to try up to ten times is not a bad idea.

The cluster users 0.6.5 with RF=3. Dynamic Snitching was not enabled.  Each operation is executed until it succeeds or until 10 retries using this php wrapper http://github.com/dynamoid/cassandra-utilities

Hosting virtual machines on Solaris

Hosting virtual machines inside an OpenSolaris box is very easy with VirtualBox. Here’s a quick tutorial how to install an ubuntu into a virtual machine:

  1. Download VirtualBox from here.
  2. Open the manual into a tab from here.
  3. Follow the installation manual at chapter 2.4. The installation scripts will install VirtualBox under /opt, so if you want, you can now create a new zfs filesystem for /opt so that it wont pollute your root installation partition.
    Note: If you are using Nexenta, you need to use /usr/sun/sbin/pkgadd instead of simply pkgadd.

    Note:If you receivere this error:

    ## Waiting for up to &lt;300&gt; seconds for package administration commands to become available (another user is administering packages)
    pkgadd: ERROR: Unable to acquire package administration lock for this system; try again later
    pkgadd: ERROR: Unable to lock this zone for administration

    The sollution is to “cp /usr/sun/bin/pkgadm /usr/bin” and repeat the step.

  4. After these steps the VirtualBox host environment is installed.

So, you have now installed the server stuff, now it’s time to install the ubuntu into a virtual machine. If you are using Windows as your desktop follow the steps in chapter 7.4. Otherwise consult the manual to find a proper installation way. The chapter 7.4 guides you to use the headless installation where you connect to the virtual machine using windows remote desktop (which is quite nice). You can download the 32-bit ubuntu iso from here, or use some other cd/dvd image to boot up your system.

If you don’t want to use nat for your virtual machine and prefer a direct ip instead, replace step

VBoxManage modifyvm "Windows XP" -memory "256MB" -acpi on -boot1 dvd -nic1 nat

with

/usr/lib/vna e1000g0 0:0:0:0:10:01
ifconfig vnic0 plumb
ifconfig vnic0 dhcp
VBoxManage modifyvm "Windows XP" -memory "256MB" -acpi on -boot1 dvd -nic1 hostif -hostifdev1 vnic0

where e1000g0is the name of your physical network interface (use <em>ifconfig -a</em> to look it up) and0:0:0:0:10:01is an unique MAC address you invented from your hat. The VRDP (remote desktop server) will be binded to the ip of vnic0 interface which you can check with "ifconfig vnic0".

After setting up the VM you can finally start it by typing “VBoxHeadless -s <vm name>” and then connecting into it using remote desktop. Notice that the guest operating system might have different IP, so you need to check the guest IP after installation if you wish to connect into the guest with SSH.

Miten ZFS toimii levyjen kanssa ja storagepoolin anatomia.

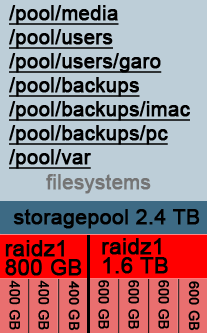
ZFS koostuu yhdestä levypoolista (storagepool). Levypool voi sisältää yhden tai useampia tiedostojärjestelmiä, jotka jakavat yhdessä koko levypoolin tilan. Tiedostojärjestelmien luonti on helppoa ja kevyttä, eli esimerkiksi jokaiselle käyttäjälle voidaan helposti luoda oma tiedostojärjestelmä. Tiedostojärjestelmät voivat muodostaa hierarkioita, tiedostojärjestelmille voidaan asettaa tilarajoituksia (quota), varata tietty miminimäärä tilaa (reserve space) ja tiedostojärjestelmiä voidaan jakaa (export) helposti esimerkiksi windowsiin CIFS-protokollalla (tunnetaan myös nimillä smb ja samba), tai nfs protokollalla. Yhdessä tietokoneessa voi olla useita eri levypooleja. Solaris (ja grub) osaa käynnistyä ZFS:ltä, kunhan levypoolissa ei ole raidz-virtuaalilevyjä.

Yksi levypool koostuu vähintään yhdestä virtuaalilevystä (VDEV). Virtuaalilevyjä voidaan lisätä vapaasti jälkeenpäin levypooliin, mutta niitä ei voida toistaiseksi ottaa pois storagepoolista. Levypoolin koko on sen virtuaalilevyjen kokojen summa. Levyn lisäyksen jälkeen olemassaolevaa dataa ei automaattisesti jaeta tasaisesti kaikille virtuaalilevyille, vaan ainoastaan virtuaalilevyn lisäyksen jälkeen kirjoitettu data jaetaan tasaisesti. Virtuaalilevyn lisäys siis nopeuttaa levyjärjestelmän toimintaa, mutta nopeushyöty ei tule heti esiin vanhalla datalla.

Jos virtuaalilevyssä on useampi kuin yksi levy, virtuaalilevyn koko määräytyy pienimmän fyysisen levyn koon mukaan. Eli jos levyssä on kahden, kolmen ja viiden gigatavun levyt, virtuaalilevyn koko on 2 GT * 3 = 6 GT (tässä ei oteta huomioon peilausta tai raidz:n käyttöä, jolloin levytilaa kuluu virheenkorjauksessa käytettävän pariteettidatan säilytykseen). Kuitenkin jos pienin levy vaihdetaan isommaksi (olettaen, että virtuaalilevy tukee virheenkorjausta, eli on joko peilattu, tai varmennettu raidz:lla), virtuaalilevyn koko kasvaa automaattisesti. Eli jos kahden gigatavun levy vaihdetaan neljän gigatavun levyksi, niin virtuaalilevyn koko muuttuu 12 gigatavuksi (4 GT * 3 levyä).

Virtuaalilevy (VDEV) voi olla:

  • Tiedosto (iso tiedosto joka toimii “levynä”)
  • Levyn slice tai partitio.
  • Kokonainen levy (suositeltavin tapa)
  • Joukko levyjä, joiden välillä tieto peilataan (eli mirror-levysetti)
  • Joukko levyjä jotka muodostavat RAIDZ1 tai RAIDZ2 virtuaalilevyn.
  • Erikoislevy (cache-levy, log-levy tai spare-levy)

Yhdessä levypoolissa voi olla sekoitettuna erilaisia virtuaalilevyjä, mutta tätä ei suositella. Esimerkiksi levypoolissa voi olla raidz1 ja raidz2 -virtuaalilevypakat, mutta tälläisen luonnin yhteydessä käyttäjää varoitetaan ja pyydetään erikseen hyväksymään eri vdev tyyppien sekoittaminen keskenään.

raidz (eli raidz1): Vähintään kolme levyä (jossa levy on tiedosto, slice, partitio tai kokonainen levy (suositeltavin tapa)) ja kestää yhden levyn hajoamisen. Virheenkorjaukseen käytettävä data vie yhden levyn kapasiteetin verran tilaa ja virheenkorjaukseen käytetty data jaetaan tasaisesti kaikille levyille (toimii samalla periaatteella kuin RAID-5). Tällä hetkellä levyjä ei voida lisätä tai poistaa virtuaalilevypakasta, mutta levyjä voidaan vaihtaa yksi kerrallaan isompiin levyihin, jolloin virtuaalilevypakan koko kasvaa. Mikäi virtuaalilevypakka koostuu erikokoisista levyistä, kaikki levyt käyttäytyvät levypakan pienimmän levyn koon mukaan.

raidz2: Vähintään neljä levyä ja kestää kahden levyn hajoamisen. Virheenkorjaukseen käytettävä pariteettidata käyttää kahden levyn kapasiteetin verran tilaa. Nopeampi kuin raidz1, toimii samalla tavalla kuin RAID-6. Käyttäytyy muuten kuten raidz1.

mirror, eli peilattu levysetti: Vähintään kaksi levyä. Kaikki data kopioidaan kaikille levyille, eli levypakasta voi hajota kaikki paitsi yksi levy. Levypakkaan voidaan lisätä levyjä (kunhan ne ovat vähintään samankokoisia kuin levypakan pienin levy) tai poistaa levyjä.

spare, eli varalevy: Oltava vähintään samankokoinen kun koko levypoolin pienin levy (jotta levyä voidaan käyttää varalevynä)

log ja cache -levyt: Erikoistapauksia, kotikäyttäjä ei tarvitse näitä.

Kysymyksiä ja vastauksia NASini toiminnasta.

Olen keskustellut NAS projektistani muropaketissa, jossa esitettiin lukuisia kysymyksiä projektistani:

Q: Miksi RAIDZ1 + spare, eikä RAIDZ2 ilman sparea:
A: Hankin aluksi kolme levyä ja hankin sparen jälkeenpäin. En ole tutustunut, että kumpi olisi parempi ratkaisu. Yksi storagepooli koostuu vähintään yhdesteä levysetistä (esim RAIDZ1 setti, RAIDZ2 setti, peilattu setti tai yksittäinen levy). Jos levysettejä on useampia, niin levysettien pitää (ei kuitenkaan pakko, mutta suositus) olla samanlaisia. Eli samaan storagepooliin ei kannata laittaa RAIDZ1 settiä ja RAIDZ2 settiä, tai RAIDZ1 ja MIRROR-settiä. Kun storagepoolissa on useita settejä, niin samaa sparea voidaan jakaa kaikkien settien kanssa.

Lisäksi spare voidaan ehkä säätää sammumaan kun sitä ei käytetä. En ole varma, olenko saanut tätä jo tehtyä (en ole keksinyt tapaa varmistaa asiaa), mutta sen pitäisi kait olla mahdollista. Eli tällöin levyn rikkoontuessa spare ei olisi pyörinyt tyhjillään, vaan olisi ollut paikallaan varastossa.

Valittaessa RAIDZ2:en ja RAIDZ1 + sparen välillä pitää myös hieman pohtia tehokysymyksiä. En ole varma miten RAIDZ2 käyttäytyy nopeuden suhteen, joku muu saa selvittää.

RAIDZ1:stä ei voi muuttaa jälkeenpäin RAIDZ2:ksi. Storagepoolista ei myöskään toistaiseksi voi ottaa levysettejä pois, eli storagepoolin kokoa ei voi pienentää jälkeenpäin!

Kuitenkin laajennustilanteessa voitaisiin luoda uusi storagepooli uusilla levyillä, siirtää kamat offline tilassa vanhalta poolilta uudelle, poistaa vanha pooli ja siirtää vanhan poolin RAIDZ1 + spare uuteen pooliin RAIDZ2:ena (jos se on mielekästä) ja laittaa vaikka uusi spare, joka sitten jaetaan koko poolin kesken.

Q: Nyt kun sinulla homma jo pyörii, niin olisiko jotain komponenttia, joka tuosta kokoonpanosta kannattaisi vaihtaa / valita toisin?
A: Kyllä. Itselläni oli isoja performanssiongelmia Gigabyten emolevyn sisäänrakennetun Realtek 8111B -verkkopiirin kanssa. Ongelmat korjaantuivat ostamalla 25 euron Intelin PCI Gigabittinen verkkokortti.

Q: Oliko ajureiden kanssa mitään ongelmaa?
A: Ei.

Q: Miten hyvin riittää tehot tossa prossussa?
A: Hyvin. Olen harkinnut mm. virtuaalikoneiden hostaamista koneessa, niitä varmaan menisi sinne

Q: Kuin ison CF:n laitoit?
A: Kaksi kappaletta kahden gigan kortteja. Nexentan asennusohjelmassa on bugi, joka estää suoran asennuksen kahden gigan kortille (valittaa, että “kiintolevy” on muutamaa megatavua liian pieni). Tämä on kierrettävissä, mutta en muista juuri nyt tarkasti miten se tapahtuu. Voin kuitenkin opastaa jos jollakulla tulee sama ongelma esiin ja kirjoitan siitä kunnon ohjeet blogiini.

Solaris osaa bootata ZFS:ltä, mutta vain jos ZFS ei sisällä RAIDZ levypakkoja. Eli tarkoitus oli peilata käyttöjärjestelmä kahdelle eri CF kortille. Jostakin syystä kone tunnistaa vain yhden CF kortin. Jos laitan molemmat kortit sisään, niin kone ei tunnista kumpaakaan. Tällä hetkellä minulla on siis systeemilevy vain yhdellä CF:llä. Jos saan joskus koneen tunnistamaan toisenkin CF kortin, niin voin (ymmärtääkseni) lisätä sen lennossa sisään ja peilata systeemilevyn myös toiselle CF kortille.

Q: Näillä näkymin ois tarkotuksena laittaa 6x500GB levyt raid-z2:lla, mutta saapa nähä mitä sitä lopulta keksii.. Meinaa olla ongelma toi ettei pysty levysettiin lisään uusia levyjä, tällä hetkellä on koneessa 3x500GB (jotka ei oo tyhjiä) niin ois kiva saada ne tohon NAS:siin, mutta pitäis siirtää data väliaikasesti “johonki muualle” eli menee vähän hankalaksi.. :)

A: Voit tehdä esim näin: Luot uuden levypoolin johon laitat 5 levyä RAIDZ2:een. Kopioit datat vanhoilta levyiltä tähän uuteen pooliin. Otat vanhat 500 GB levyt ja lisäksi kuudennen ylijääneen levyn ja lisäät ne yhtenä neljän levyn RAIDZ2 settinä uuteen storagepooliin.

Eli levysettiin ei voi lisätä uusia levyjä, mutta storagepooliin voi lisätä uuden levysetin (jolloin pooli “stipettää” datat levysettien välillä joka lisää performanssia)

Q: Tosin kovalevyiksi olen ajatellut 1T levyjä. Onko suositella jotain tiettyä levyä?
A: En osaa suositella. Kannattaa puntaroida hinta-koko suhteen ja haluttujen levyjen määrän kanssa ja valita optimaalinen kokoonpano levyjä.

Q: Oliko vielä joku tietty syy käyttää kahta erillistä 1GB palikkaa yhden 2GB palikan sijaan?
A: Muistit toimivat dualchannel moodissa, eli nopeammin kuin yksi 2GB palikka,.

Fixing ZFS CIFS share video lagging problems

I had some bad performance problems with my new NAS box running ZFS which resulted terrible video and audio lagging problems in windows when I tried to stream video from zfs share via CIFS to a media player running in windows. Even playing mp3 music files from CIFS share in Winamp resulted with very bad lagging, like I was playing a very scratched CD.

I asked help from opensolaris forums (very friendly people there!) and ended up bying a new Intel Gigabit Ethernet PCI card for 25 € which replased the Gigabyte motherboard onboard Realtek 8111B network chip and fixed my problems.

Sharing iSCSI volumes from Solaris to Windows XP

I just noticed that I could create iSCSI volumes onto my ZFS pool and share them easily over network to other machines. And I mean easily!

  1. Enable the iSCSI service:
    # svcadm enable iscsitgt
  2. Create a zfs stub for your volumes:
    # zfs create storagepool/volumes
    # zfs set shareiscsi=on storagepool/volumes
  3. Create a volume
    # zfs create -V 20g storagepool/volumes/test
  4. Verify that sharing was successfull:
    # iscsitadm list target
    Target: storagepool/volumes/test
        iSCSI Name: iqn.1986-03.com.sun:02:737cb2f1-ea2b-e6d5-b8af-e335e05852f6
        Connections: 0
  5. Install Microsoft iSCSI Software Initiator Version from here
  6. Go to Control Panel -> iSCSI Initiator -> Discovery, add the solaris server ip to Target Portals, then go to Targets tab and Log On to the volume.
  7. Go to the Computer Management and format the new iSCSI partition and you’re ready to go.

I benchmarked read speeds of 70 to 80 MB/sec with access time of about 2.3 ms over a 1GBps ethernet network. Not bad, could be a bit faster, but the network will anyway be a bottleneck compared to local drivers. My 160 GB RAID-0 stripe gives 260 MB/sec read times with 18.4 ms access time and 300 GB RAID-1 mirror gives 110 MB/sec with 19 ms access time (both are local drivers)

So what I can do with iSCSI volumes? I could for example use them as virtual machine disks, which would allow me to move virtual machines more easily across my network (though I dont have that many machines where to move them). Also the access time is blazingly fast, so I will also try to use them as video editing storage, as suggested in this article.

NAS projekti OpenSolariksella ja ZFS:llä

Speksit:

  • Nexenta OpenSolaris distribuutio
  • Tukee ZFS:ää
  • Aluksi neljä kappaletta 750 gigan Seagate Barracuda 7200.11 levyjä, joista kolme levyä muodostaa raidz1 (Solariksen RAID-5) -setin ja yksi levyistä on varalevy (spare).
  • Hotswap tuki, levyt voidaan vaihtaa lennossa.
  • Boottaus ja itse käyttöjärjesetlmä CompactFlash kortilta. /var osio on levypoolissa, jolloin CF kortille ei tarvitse juuri kirjoitella.
  • Laajennettavissa 13 SATA-levyyn asti.
  • Levytilan jako CIFS (Windowsin levyjako), FTP:n, NFS:n, SSH:n ja WWW:n yli (vain luku).
  • Tukee useita eri käyttäjiä ja tarvittaessa toimii Windows Domainissa.

Setti on kasattu isoon Antecin pelikoteloon, joka valittiin isojen tuulettimien ja ennenkaikkea runsaiden 5.25″ laitepaikkojen takia, joita kotelossa on yhdeksän. Levytilaa jaetaan CIFS:n (eli Samba, eli Windowsin levyjako) avulla ja tarvittaessa myös NFS:llä ja ehkä tulevaisuudessa myös iSCSI:llä (SCSI over Internet).

Nexenta on OpenSolaris-distribuutio, joka on käytännössä Debian OpenSolariksen kernelillä, eli ohjelmia saa helposti apt-get:llä, joka oli merkittävä valintakriteeri itselleni. Tietenkin kaikki asiat eivät toimi kuten Linuxissa, mutta Debianmaisuus teki Solarikseen siirtymisestä helpompaa.

Testeissä ZFS on toiminut erinomaisesti. Kirjoitusnopeus levypakkaan on 120 Mt/s ja lukunopeus noin 180 Mt/s. Verkon yli yhdeltä XP koneelta kirjoitusnopeus on noin 60 Mt/s gigabitin verkon yli (tässä on varmaan vielä parantamisen varaa). Testeissä yhden levyn irroitus on toiminut erinomaisesti, uuden levyn voi lisätä lennossa sisään ja itseasiassa yksi kolmesta levyistä ehti jo hajota ja ZFS hanskasi tilanteen erinomaisesti ilman ongelmia. Levyrikon sattuessa järjestelmä ottaa automaattsisesti varalevyn käyttöön ja lähettää ilmoituksen sähköpostitse. Nykyinen configuraatio antaa 1.3 TB käyttötilaa ja tilaa voi laajentaa helposti lisäämällä uusia kolmen levyn settejä järjestelmään.

Kotelosta on muutamia kuvia kamerassa, lisään ne jossakin välissä. Kokoonpano ei ole erityisen hiljainen, mutta se ei nykyisessä sijoituspaikassa ole ongelma.

Komponenttilista (verkkokaupan tuotekoodit):

  • 0266: Antec Nine Hundred ATX kotelo. 9 5.25″ laitepaikkaa ja ärsyttävät siniset ledit tuulettimissa, jotka sai helposti pimeäksi. 108.90 €
  • 5017: Corsair Twin2X 2x1GB DDR2 800Mhz KIT -muistimodulipari. 43.90 €
  • 8322: Intel Dual Core E2180 2,0GHz -prosessori LGA775-kantaan. 57.90 €
  • 8865: Sandisk 2GB CompactFlash Ultra II muistikortti. 24.90 €
  • 16539: Gigabyte GA-P35-DS3P Intel P35 ATX-emolevy LGA775 -prosessoreille. 8 SATA-väylää. 127.90 €
  • 20028: Antec NeoPower HE High Efficiency 430W -virtalähde. 60.90 €
  • 24126: Seagate Barracuda 7200.11 750GB SATA-II 4 kpl * 120.90 = 483.60 €
  • 30332: Chieftec SNT-2131SATA SATA-kiintolevykehikko. 2 * 61.90 = 123.80 €
  • Lisäksi CompactFlash to IDE adapteri noin 4 euroa.

Yhteensä: 1035.80 €, levytilaa 1.3 TB, noin 80 senttiä per gigatavu (jos on spare-levy), 70 senttiä ilman sparea. Levytilan laajennus nykyhinnoilla 2.6 TB: 424.6, jolloin hinta olisi 56 senttiä per gigatavu, 51 senttiä ilman sparea.

Vertailun vuoksi: Buffalo TeraStation Live 2TB, jolloin hyötytilaa RAID-5-setupissa olisi 1.35 TB. Hinta 731.90 €, hinta per gigatavu: 54 senttiä. Laajennus tapahtuisi ostamalla toinen boksi, jolloin tilaa olisi 2.7 TB ja hinta per gigatavu pysyisi samana, jolloin buffalo olisi omaa NAS boksiani kalliimpi.

Buffalo olisi halvempi, mutta huomattavasti hitaampi ja buffaloa ei voi laajentaa. Buffalo ei myöskään mahdollista spare-levyn käyttöä, eli levyrikon sattuessa järjestelmä on vaarassa kunnes käyttäjä vaihtaa itse rikkinäisen levyn. Solariksen ZFS mahdollistaa myös RAIDZ2:en, joka sallii kahden levyn samanaikaisen hajoamisen. Erään testin mukaan Buffalo lukee 20Mt/s ja kirjoittaa vaivaiset 3.3 Mt/s. Oma NAS boksini hakaa tämän siis nopeudessa 6-0.

FAQ: Mitä etuja ZFS tarjoaa?

Solaris tarjoaa ZFS:än, joka on monella tavalla parempi kuin Linuxin RAID ja sen tiedostojärjestelmät:
ZFS koostuu storagepoolista. Yksi pooli sisältää yhden tai useamman levysetin. Levysetti voi olla joko yksittäinen levy, peilattu levypari (tai usempi levy peilattuna keskenään), kolme tai useampi levy laitettuna raidz1:llä (Solariksen vastine RAID-5:lle), tai neljä tai useampi levy laitettuna raidz2:lla (mahdollistaa kahden levyn hajoamisen). Jos poolista loppuu levytila, niin tarvitsee ainoastaan lisätä uusi levysetti pooliin ja avot. ZFS tarjoaa myös tiedostojärjestelmän, joita on helppo muodostaa lennossa, vaikka oma jokaiselle käyttäjälle.

Linuxissa vastaava vaatisi RAID:in, LVM:n ja tiedostojärjestelmän käyttöä yhdessä. Jos linuxissa loppuu levytila, niin pitäisi lisätä uusi levysetti, liittää levysetti LVM:ään, kasvattaa LVM:ssä luodun partition kokoa ja lopuksi kasvattaa partitiolla olevan tiedostojärjestelmän kokoa. Hankalaa ja monivaiheista. Lisäksi ZFS:ssä kaikki tiedostojärjestelmät jakavat yhdessä levypoolin levytilan. Linuxissa eri tiedostojärjestelmät tarvitsevat oman partition (joka tehtäisiin LVM:llä) ja jos yksi tiedostojärjestelmä sisältää paljon hukkatilaa, mutta muut ovat täynnä, niin on pakko lisätä uutta levytilaa ja kasvattaa täysien partitioiden kokoa LVM:llä. ZFS:llä siis kaikki tiedostojärjestelmät jakavat saman tilan, jolloin hukkatilaa ei jää (ellei erikseen määritellä tiedostojärjestelmäkohtaisia quotoja, eli levytilarajoituksia)

Lisäksi ZFS suojaa paremmin levyvirheiltä.

Uusi työpaikka – Sulake Dynamoid

Allekirjoitin eilen työsopimuksen Sulake Dynamoidille ja irtisanoin tänään itseni Itellan palveluksesta. Olo on hieman ristiriitainen, olen kuitenkin kasvanut koko nuoruuteni tässä nykyisessä työpaikassa, joka aikaisemmin tunnettiin nimellä Elma ja nyt nimellä Itella Information Oy. Odotan kuitenkin innolla uusia työtehtäviä ja jään muistelemaan haikeana näitä menneitä työvuosia :)

Pannupizza

Perinteisiä pizzoja tulee tehtyä aina välillä kotona, joskus käyttäen kaupan valmispohjia ja joskus omasta taikinasta tehtyinä. Kuitenkaan en ole koskaan tehnyt varsinaisesti pannupizzaa. Tämä ohje on osittain sovellettuna Cooking For Engineers -sivuilta.

Ainekset:pannupizza

  • 2 dl lämmintä vettä (noin +42 astetta)
  • 3 tl kuivahiivaa
  • 1 tl sokeria
  • 1/2 tl suolaa
  • 4 dl vehnäjauhoja tai pizzajauhoja tai 3 dl vehnäjauhoja ja 1 dl vehnäleseitä
  • Mozzarellajuustoa tai pizzajuustoa reilusti
  • 1 tlk tomaattimurskaa
  • Valkosipulia
  • Suolaa
  • Pippuria
  • Oliiviöljyä
  • Lisäksi täytteitä oman maun mukaan. Itse laitoin pepperonimakkaraa, jalopenoviipaleit, aurajuustoa, ananaspaloja ja aurinkokuivattuja tomaatteja.

Valmistus (tomaattikastike):

  1. Murskaa kaksi valkosipulia pieneen kattilaan (mitä pienempi sen parempi, kunhan sinne mahtuu hyvin purkillinen tomaattimurskaa).
  2. Lisää ruokalusikallinen oliiviöljyä.
  3. Keitä hiljalleen kunnes valkosipuli alkaa kevyesti ruskettua (mutta ei saa palaa!).
  4. Lisää tomaattimurska.
  5. Keitä puolella teholla keitos kasaan, jotta tomaattimurska luovuttaa ylimääräisen nesteen pois.

Valmistus (taikina):

  1. Sekoita keskenään jauhot, kuivahiiva, sokeri ja suola.
  2. Lisää lämmin vesi hitaasti sekoittaen (esim puulastalla).
  3. Vaivaa taikina esimerkiksi öljytyin käsin.
  4. Peitä kulho liinalla ja anna nousta noin kaksinkertaiseksi.

Taikinan noustua kokoa pizza:

  1. Voitele pizzavuoka voilla tai oliiviöljyllä.
  2. Muotoile taikina vuokaan käyttäen käsiä. Pohja saa olla paksu ja taikina saa nousta reilusti reunoille.
  3. Levitä tomaattikastiketta pohjalle.
  4. Mikäli haluat paljon täytteitä lisää osa täytteistä tässä vaiheessa.
  5. Lisää reilusti juustoraastetta
  6. Lisää loput täytteet
  7. Ripottele halutessasi hyvin vähän juustoraastetta täytteiden päälle, mutta älä kuitenkaan hautaa täytteitä juuston alle. Ideana on, että juusto on täytteiden alla, eikä päällä.
  8. Paista 200’C noin 20 minuuttia.